
Hobart, Tasmania · across the city centre: three surveys fused, in true colour · Showcase
Hobart · Tasmania · 2008–2024
Hobart 3D city model
Three airborne surveys flown over 16 years, fused into one true-colour model of the city centre. Every point graded, every modelled wall flagged.
Showcase: GroundMap processing of public survey data. Not client work.
- Measured points, three surveys
- 348million
- Points where two or more aligned surveys agree within 15 cm
- 64.7million
- Modelled wall points, every one flagged
- 49.8million
Challenge
One airborne survey of a city leaves gaps: dark roofs, shadowed lanes and almost no walls. Hobart has three surveys, from 2008, 2011 and 2024, flown by different programs. The 2011 survey is on GDA94, about 1.5 m from GDA2020 here, with no coordinate system in its file headers; the 2008 survey was offset and slightly tilted, and the city changed between all three.
Approach
The 2024 survey set the frame. The 2008 and 2011 surveys were brought into GDA2020, aligned to it on stable ground and kept only where they agree with the 2024 surfaces; vegetation and ground that had changed were excluded. Walls no survey measured were modelled from the measured roof outlines and flagged. Every point was then graded by how many surveys measured it and whether they agree.
Outcome
One model of the city centre, in true colour and by confidence class. 13.8 million points from the earlier surveys passed every check and were kept. Where aligned surveys disagree, the difference is mapped as change rather than averaged away, and every modelled point carries the LAS synthetic flag, so any software can leave it out.
Confidence classes
- 3 passes agree2.2 %After alignment, both other passes measure the surface height within 15 cm of the reference pass.
- 2 passes agree14.0 %After alignment, two passes measure the surface height within 15 cm of each other.
- Single pass64.5 %Measured, not cross-checked: one pass reached it, or it lies below the top surface, such as under canopy.
- Change detected6.8 %Passes differ by more than 15 cm: real change, or disagreement between surveys. Change maps test it separately.
- Modelled12.5 %Walls modelled from measured roof outlines, flagged: no pass measured them. Never counted as confirmed.
Before / after
Terrain: one survey,
four fused
A terrain product south of the city model, from four surveys, 2011 to 2023/24.
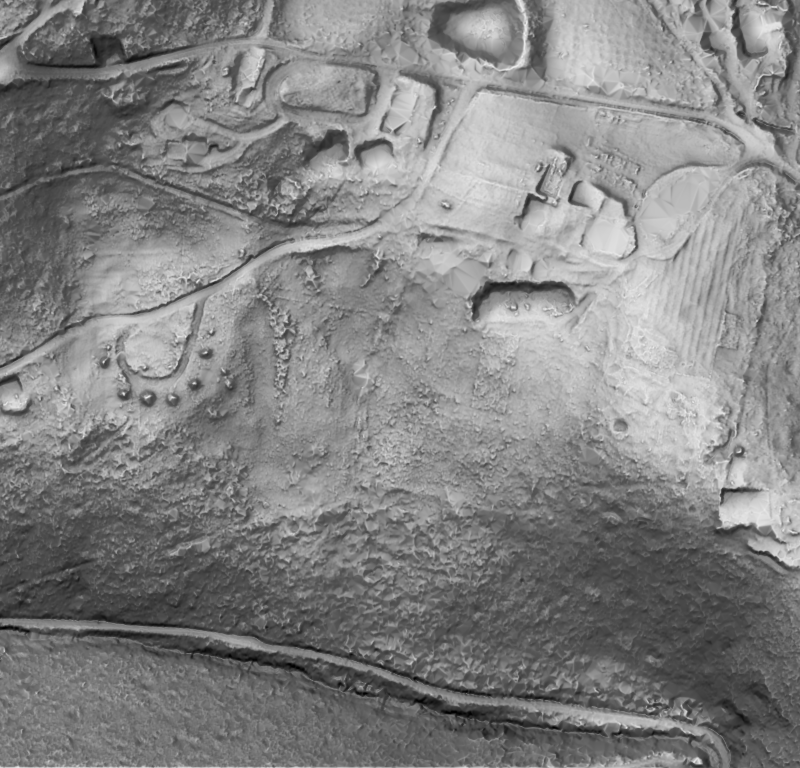
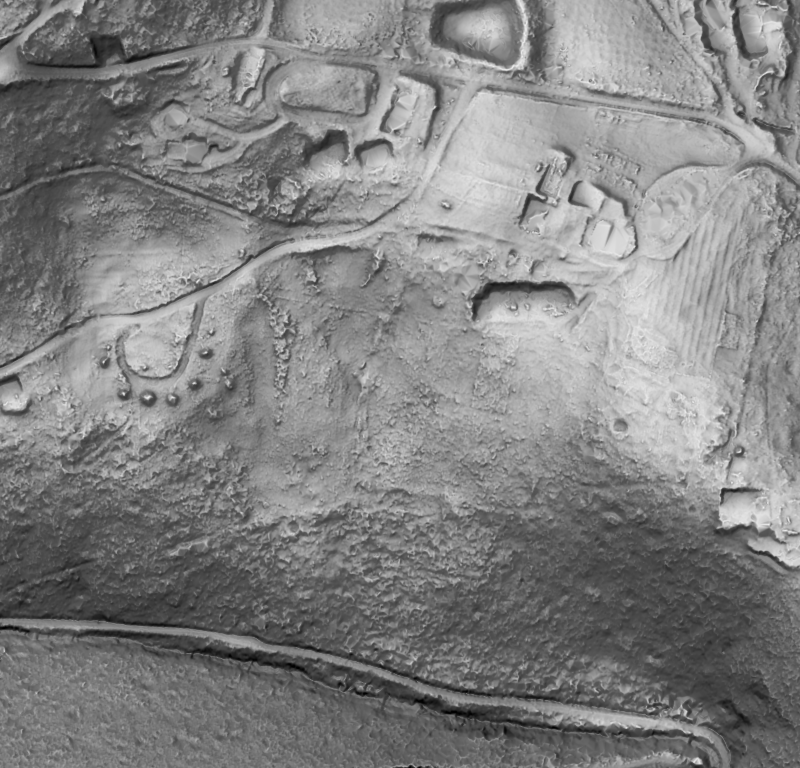
Shaded relief, same extent. Survey data: Hobart City 2023/24 (captured by Fugro for the State of Tasmania; theLIST; CC BY 3.0 AU), Kingborough 2022 (no licence on record), South East 2011 (theLIST; CC BY 3.0 AU) and Mount Wellington 2011 (no licence on record), via ELVIS. Processing: GroundMap. Showcase: GroundMap processing of public survey data.


Projects
All projects ↗
Satsop plant study
Inside an unfinished nuclear power plant: two separate survey campaigns, registered to each other and fused on a 2 cm grid into one model of rooms, stairs and the containment ring.
- Offset between the two campaigns as delivered, removed by registration
- 20cm
- Held-out median mismatch between the two campaigns after alignment
- 13.2mm
- Surface measured by both campaigns where the two agree within 3 cm
- 86%

El Teniente underground study
44 robot-captured laser scans, delivered as raw text: no GPS, no colour, nothing aligned. Registered to each other and fused into one model of two kilometres of production tunnels.
- Laser scans registered into one model, with no GPS
- 44
- Overlapping surface registered within 1 cm
- 98.7%
- Scan pairs fitted more closely than by the dataset's published poses; the other 25 as closely, within 1 mm
- 153of 178

Change detection study: Rosebery, Lake Mackenzie, Forcett–Dunalley
Eleven years of earthworks at a mine site and two bushfires, measured from repeat airborne LiDAR: every pair of surveys aligned on stable ground, and only change beyond the level of detection counted.
- Placed beyond the level of detection (95 %), Rosebery, 2015 to 2026 (0.59 million m³ removed)
- 1.56million m³
- Area where canopy cover fell beyond the level of detection (95 %): Lake Mackenzie, 2013 to 2016
- 10,695ha
- Area where canopy cover fell beyond the level of detection (95 %): Forcett–Dunalley, 2011 to 2013
- 1,915ha
The Satsop and El Teniente figures are registration agreement between scans, not absolute accuracy against control. Satsop plant study: Showcase: GroundMap processing of public survey data. Survey data: DARPA Subterranean Challenge (Urban Circuit, Satsop, Washington, February 2020) / US Army Research Laboratory (no licence on record). Processing: GroundMap. No affiliation with the site owner or the survey teams. El Teniente underground study: Showcase: GroundMap processing of public survey data. Survey data: Chilean underground mine dataset, Advanced Mining Technology Center (AMTC), Universidad de Chile (Leung et al., IJRR 2017; CC BY-NC-ND 3.0 CL). Processing: GroundMap. No affiliation with the mine operator or the dataset authors. Change detection study: Rosebery, Lake Mackenzie, Forcett–Dunalley: Showcase: GroundMap processing of public survey data. Survey data: West Coast 2015 (theLIST; CC BY 3.0 AU), Rosebery 2026 (theLIST; CC BY 3.0 AU), North West 2013 (theLIST; CC BY 3.0 AU), Lake Mackenzie Road 2016 (theLIST; CC BY 3.0 AU), South East 2011 (theLIST; CC BY 3.0 AU) and Greater Hobart 2013 (no licence on record), via ELVIS. Fire perimeters: Fire History (Tasmania Fire Service) from theLIST © State of Tasmania (CC BY 3.0 AU). Vegetation classes: TASVEG 5.0 (NRE Tas) from theLIST © State of Tasmania (CC BY 3.0 AU). Aerial imagery © State of Tasmania (Land Tasmania), Rosebery flights of December 2015 and February 2026 (CC BY-NC-ND 3.0 AU). Processing: GroundMap. No affiliation with the operator of the Rosebery mine.